Understanding the Details Pane
The default and custom widgets are private to the login admin user. If you make changes to the default widget or create new widgets, it is only you who can view it.
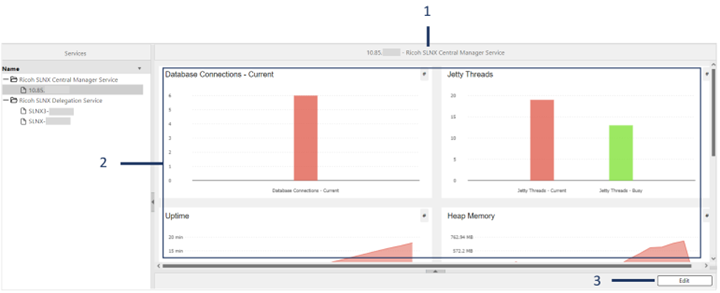
The detail pane displays the performance counter data in a graphical widget, and it has three parts.
-
Title
When you select a server in the navigation menu, the title “server address – service name” is displayed at the top of the dashboard.
If you select the service name (Ricoh SLNX Delegation Service or Ricoh Central Manager Service) in the navigation menu, only the service name is displayed on the title.
-
Body
The body of the Detail Pane contains the graphical widgets. The widgets make use of graphical designs to create a more informative representation of the performance counter data. Widgets can display data for more than one performance counter. Here is a list of available widgets.
-
Toolbar
The toolbar is displayed below the body.
You can edit the existing widgets or create a customized widget by following the steps in Create a Custom Widget.
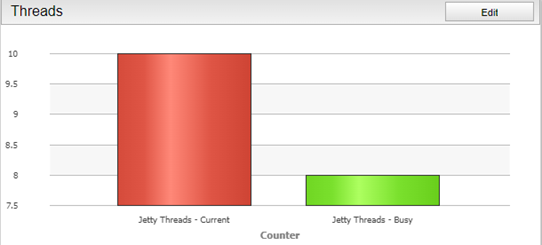
The Bar Chart widget displays the current value of the performance counters.
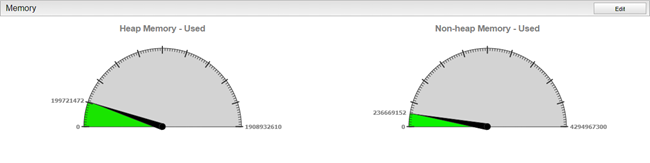
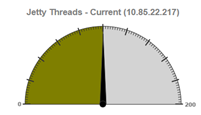
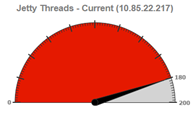
The gauge widget displays the current counter value relative to its maximum counter value.
This widget is only available to select counters (Heap Memory – Used, Non - Heap Memory - Used, Jetty Threads – Current), as not all counters have respective max values.
-
The value at the 0th degree is the minimum counter value. This is always zero.
-
The value at the 0th-180th degree is the current counter value.
-
The value at the 180th degree is the maximum counter value.
Color Indication:
As the current counter value approaches the maximum value, the color of the gauge will move from green → red.
The line Chart widget displays the historical values of the performance counters.
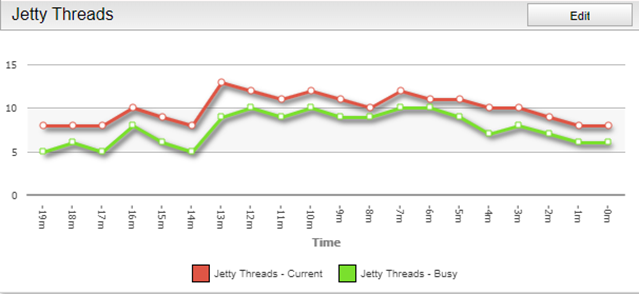
The line charts display the counter values from oldest to most recent (left to right) in time:
-
-19m displays the counter value from 19 minutes ago.
-
-0m displays the counter value most recently updated.
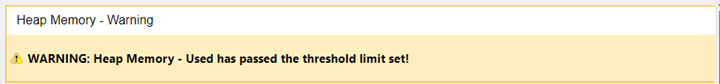
The warning widget displays a warning prompt. The most common prompt is when a performance counter has passed the threshold limit. Refer to the Edit a Performance Monitor Widget on how to edit the threshold limit.
Note that, unlike the other graphical widgets, the Warning widget only supports one performance counter.
Warning widgets can also prompt warnings when connecting to a service fails. The prompt contains an error message. Refer to Performance Monitor Dashboard for a list of error messages and respective explanations. Note that this warning prompt is only displayed when the Detail Pane is displaying counter data of a service name selected on the Navigation pane.

Clicking the  close button will silence the warning widget from the Detail Pane. However, you will be given the option to select the duration of the silence period.