Performance Monitor Dashboard
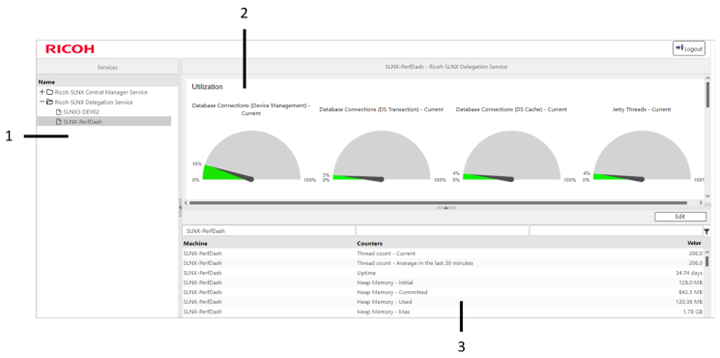
The Performance Monitor dashboard is composed of three main sections, as shown below.
-
Navigation Menu
This menu displays the list of servers which you can retrieve performance counter data from.
The servers are grouped into two service names.
-
Ricoh SLNX Delegation Service
-
Ricoh Central Manager Service
Each server is uniquely identified by its server address + <error message if there is one>.
Possible error messages are:
Error Message Explanation “The network path was not found” Unable to ping the server. “Service not running”
Connected to the server, but the service appears not running or not updating the performance counters.
“Access Denied”
The windows account running the dashboard service must elevate privileges on the remote server they are trying to read performance counters from.
“Category does not exist”
Connected to the server, but the performance monitor category does not exist. This most likely indicates the service is not running.
-
-
Detail Pane
When a server is selected in the Navigation pane, the performance counter data of the selected server is displayed in customizable graphical widgets
If you want to see other widgets on this pane, please scroll down.
Refer to Understanding the Details Pane for details.
-
List Pane
When a server is selected in the Navigation pane, the List Pane shows the counter data using a list grid for that respective node. The performance counter data is refreshed every minute, displaying the most recent values.
Refer to Understanding the List Pane for details.