Security Analyst Dashboard - Overview
The Overview screen contains four unique dashboards. By default, all four dashboards are presented in 2x2 grid format. However, you can click the Resize  button on any individual dashboard to give that dashboard primary focus on the Overview screen. The remaining three dashboards are reduced in size to accommodate the selection. To minimize the selected dashboard, you can click Resize button to display Overview screen.
Expanding or minimizing the dashboard does not automatically refresh the data. For a data refresh, click “Refresh Now’.
The information shown in the Overview Dashboard are the following:
|
Dashboard |
Description |
|---|---|
|
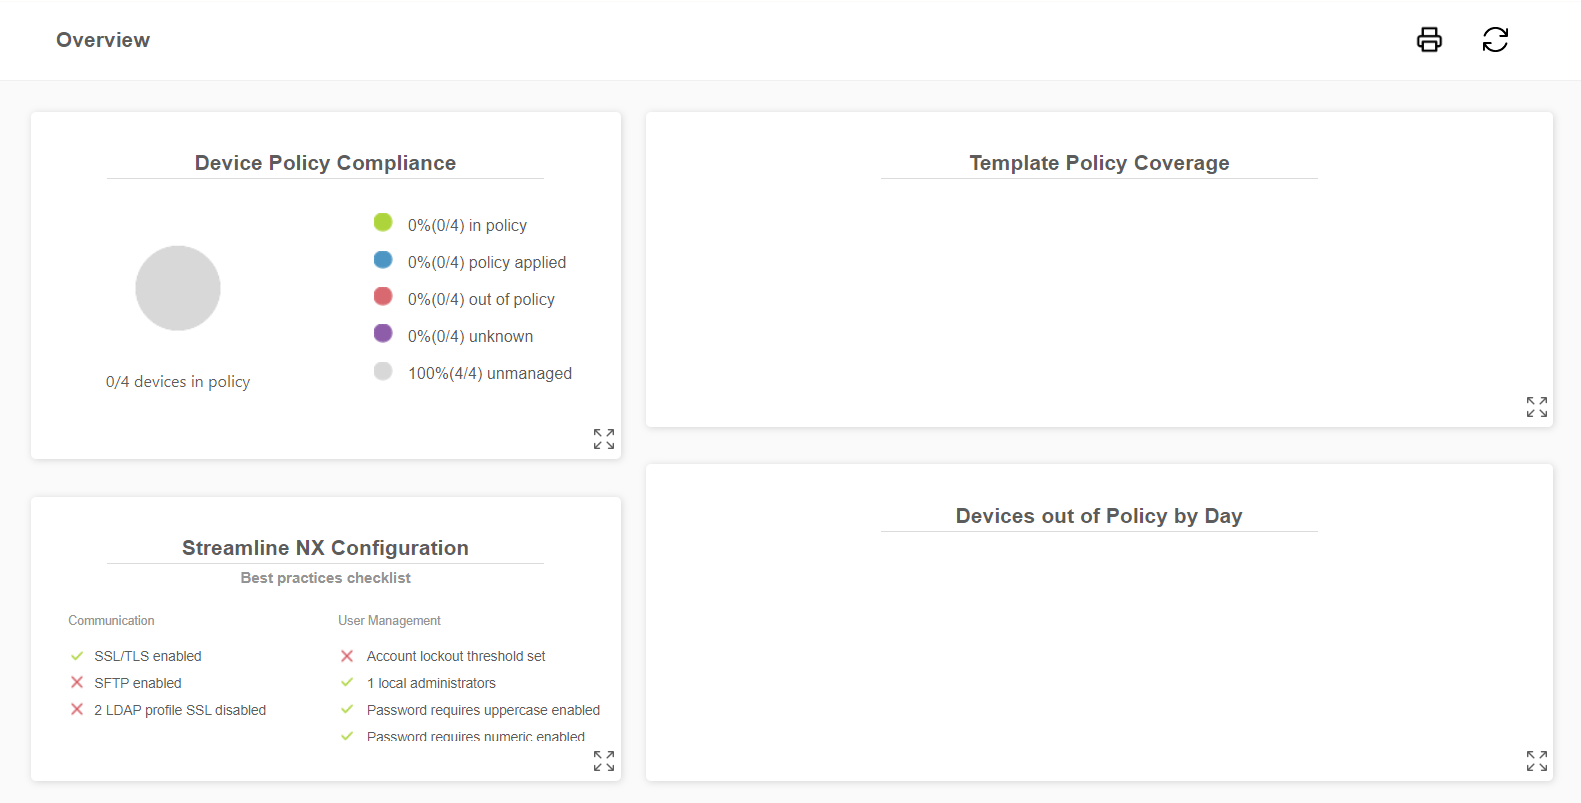
Template Policy Coverage |
This series of pie charts display the overall percentage of devices that are associated with a security template, and a series of individual pie charts per tag that show the percentage of devices covered by the specific tag. Refer to Security Templates. |
|
Device Policy Compliance |
This pie chart displays the overall device compliance status in relation to the policies you have created. You can refer to Security Analyst - Device Policy Compliance for more details. |
|
Devices Out of Policy by Day |
This pie chart displays the overall device compliance status in relation to the policies you have created. Refer to Out of Policy by Day. |
|
Streamline NX Configuration |
This checklist indicates current compliance with the suggested Streamline NX configuration best practices. |