Authentication Success Rate
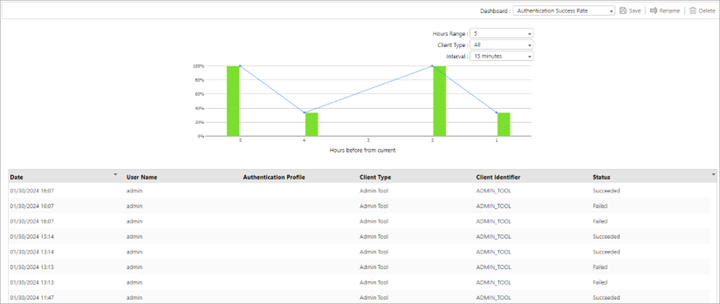
Authentication Success Rate dashboard shows the percentages of successful authentication based on the range. The data in the chart will be filtered based on the values selected for the Hours range, Client Type, and Interval dropdowns.
An example of how the Authentication Success Rate dashboard is displayed below.
To change the data displayed in the dashboard, modify the following settings to see the line and bar graph update based on your selection.
|
Item |
Description |
|---|---|
|
Hours Range |
Select past hours to show from now. Options are 5 hours, 10 hours, and 15 hours. The default is 5 hours. |
|
Client type |
Select a type of client in the dropdown. Authentication records that use the selected client type will be included in the graph. You can choose one of the following options.
|
|
Interval |
Select the interval to a group in minutes. Options are 10 minutes, 15 minutes, 20 minutes, and 30 minutes. The default is 15 minutes. |
The list below the graph displays the authentication information where the graph data is coming from.
If you change the Hours Range, Client Type, or Interval, the list changes based on the authentication logs that match the settings.