Dashboard - Policy Compliance History
This dashboard helps you to determine a device’s compliance status over time. When you select Policy compliance history from the View by list, you can set a specific time period prior to view in graph format. You can also view the data for a specific device, device group, or all devices.
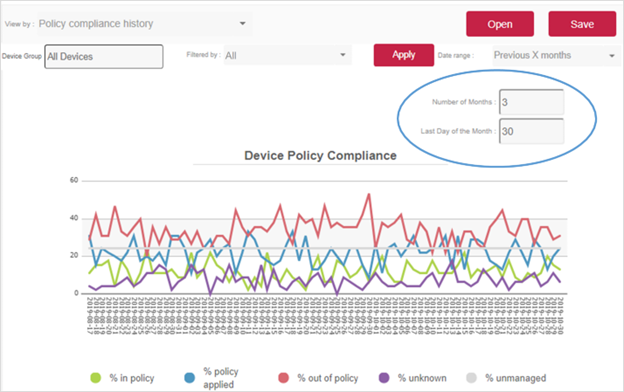
The line graph provides a visual map of device compliance (or a specific device group) over the period of time to help you determine when and how many devices became non-compliant.
-
To further filter the data, you can select an option from the Filtered by list. This will limit the graph to a show a single filter. The colour key is provided at the bottom of the graph.
-
After you select a Date range option, additional fields may be required. In the example below, Number of Months and Last Day of the Month fields are also required and appear beneath the Date range field.
After you enter or change a setting, click (Apply) to refresh the line graph.