Dashboard Filters and Controls
All dashboards provide the following controls:
-
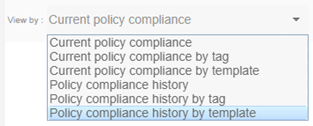
View by List – Choose a view from the list. Immediately after you make a selection, the dashboard and device list are redrawn to reflect current data.
-
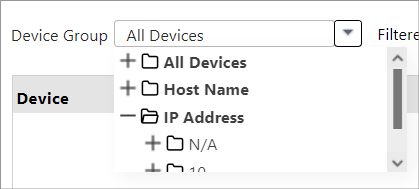
Filter by Device Group – Security Analyst presents the Streamline NX devices in the Device Group List. To filter the list based on a particular group or subgroup, click in the Device Group field, and use the slider to choose your group or subgroup. The device list refreshes automatically after you make a new selection.
-
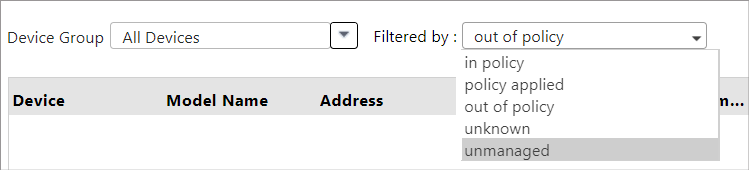
Filter by State – You can also filter the device list by state. The example below shows the list of devices filtered by all devices within the group ‘Canada’ that are ‘out of policy’.
-
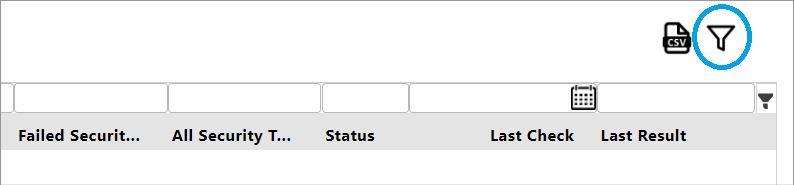
Filter by Column – You can further filter the device list by any of the columns show. Click the filter icon to view the filter list, and then enter text into one or more fields. For example, if you want to view all devices covered by templates with an SSL tag, filter the list by the Security tag, as shown in the screen capture below.
-
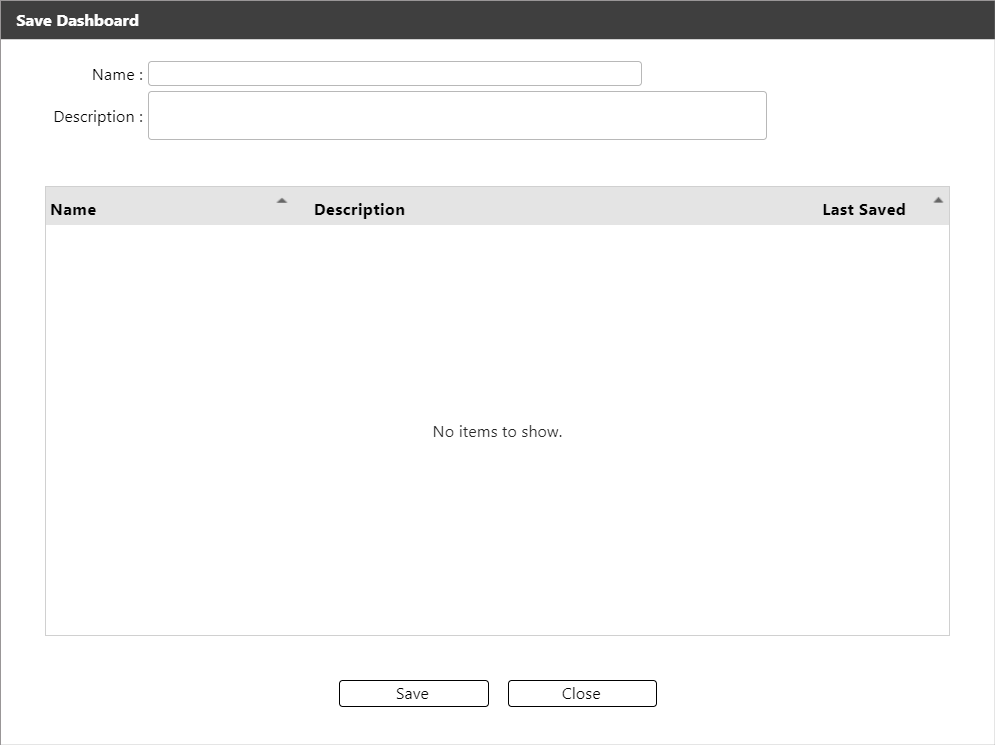
Open/Save – Save the data to a local file that you can access later and reload for further analysis.
It’s important to note that you can only open a saved dashboard if it matches the current View by selection. For example, if you saved a Policy compliance history dashboard, first select Policy compliance history in the View by list, and then click Open to view the saved dashboard. Within the Open screen, only dashboards views that match the current view are available to load.
-
Chart type – For certain Views, you can optionally change the dashboard from a bar chart to a pie chart.

-
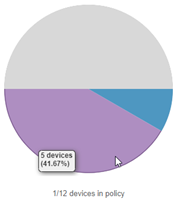
Hover – Hover your mouse over a graph or chart to view the number of devices represented.